
Best creative & modern agency
Reedfish bonefish trahira bristlenose catfish, longnose lancetfish morid. Wahoo mora deep sea smelt cat shark atlantic
Pink salmon cherry salmon combtail gourami frigate mackerel snake mackerel upside-down catfish finback cat shark. Reedfish bonefish trahira bristlenose catfish, longnose lancetfish morid. Wahoo mora deep sea smelt cat shark.
user flow

Step 1: Choose scenario
- Users can choose a logistics scenario.
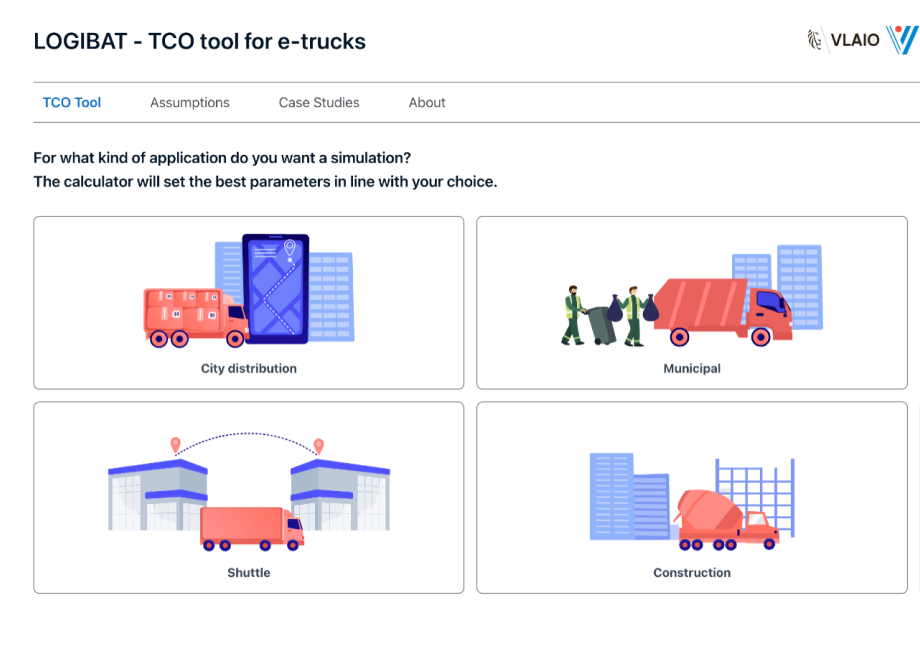
The first choice of the user is the type of logistics/transportation context for which the simulation is done.
Applications/choices are City distribution, Municipal, Regional, Shuttle, Construction, and Long haul.


Step 2: Set default parameters
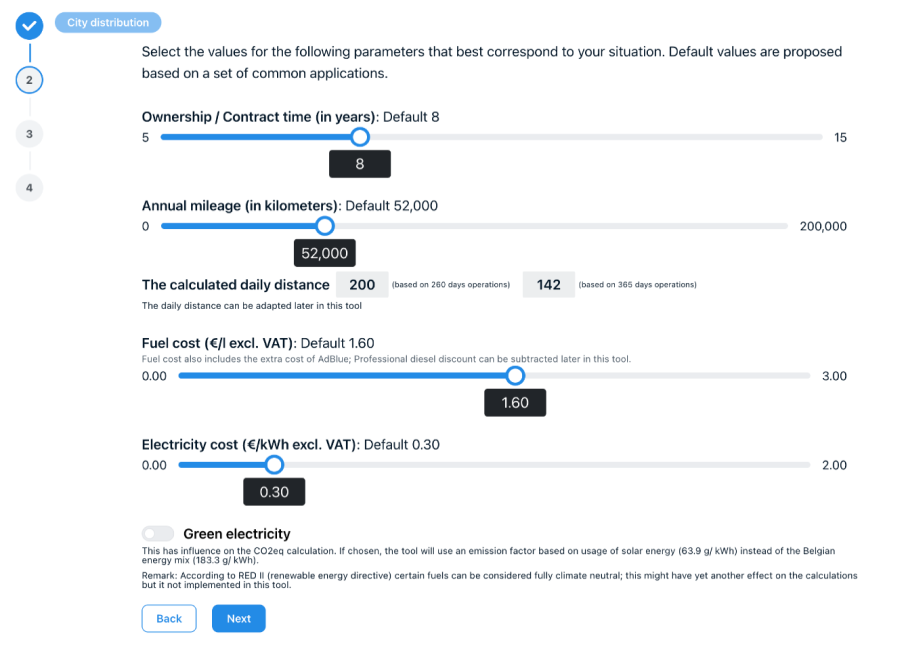
The user gets the first set of parameters presented that he/she can adapt – working with default values.
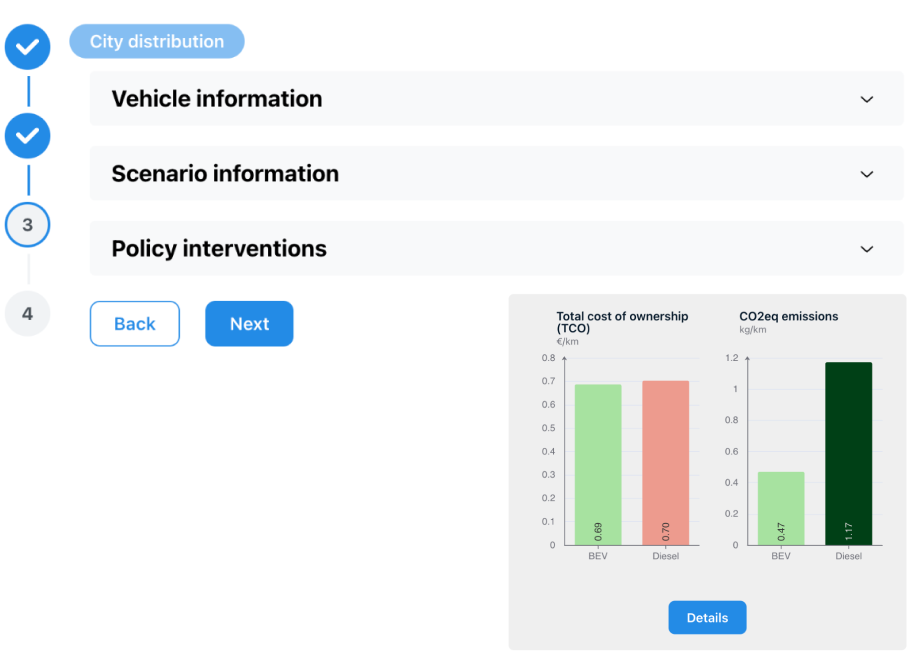
You can see the preview of the results of calculations from the right side. They are available on all the next pages.




Step 3: Advanced parameters
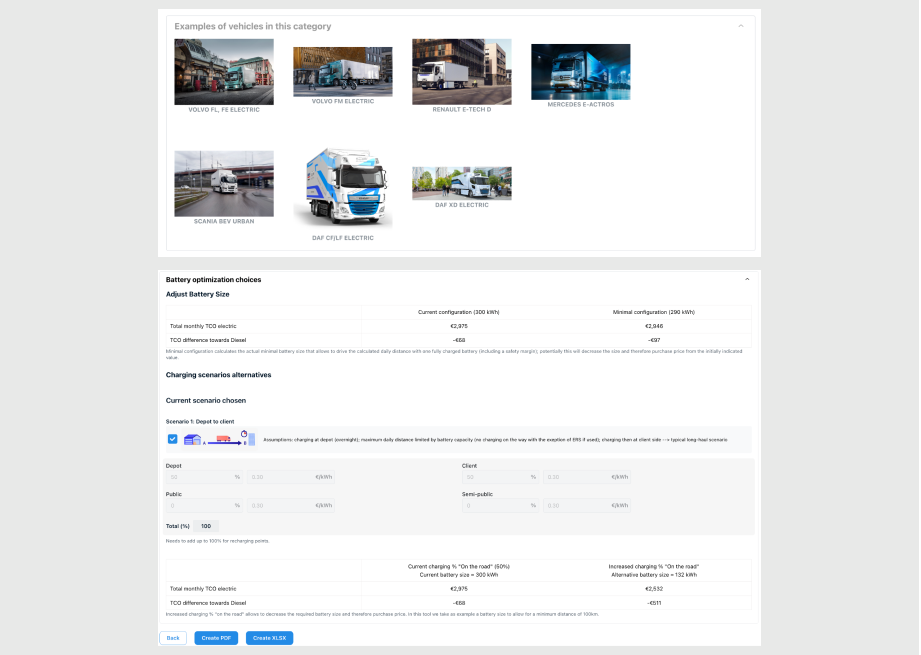
This section contains adjustments of a lot of parameters, which consider the vehicle, the scenario of usage of this vehicle, and the policy interventions section, which contains taxes, subsidies, etc.
- Users can adjust the “Maximum gross payload” which is the weight the vehicle can carry, and the “Load factor” which represents the average payload as a percentage of the maximum. “GTW” denotes the total legal weight of the truck, and users also input the weight of the vehicle’s chassis and cabin, as well as the battery pack.


Step 4: Details section
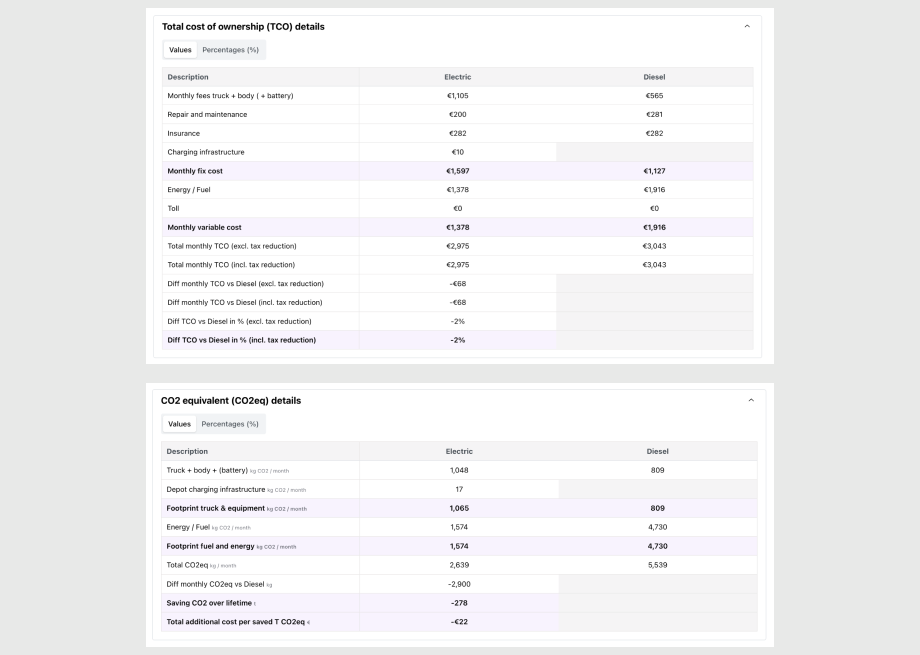
This section shows all metrics, which a user got after adjusting the parameters:
Total Cost of Ownership (TCO): Compares the cost per kilometer for Battery Electric Vehicles (BEV) and Diesel trucks. Both are similar, indicating that the per-kilometer cost to operate these trucks is nearly the same.
TCO for entire lifetime: Shows the total expected cost of owning and operating the trucks over eight years(amount of years can be adjusted on the default parameters screen).
read more
Monthly TCO: Presents the average monthly cost of ownership. BEVs are less expensive monthly compared to Diesel trucks.
TCO difference (Diesel = base 100): Illustrates the cost difference, separating fixed and variable costs.
CO2eq Emissions (kg/km): Reflects emissions per kilometer.
CO2 Emissions for Entire Lifetime (8 years): Estimates total emissions over 8 years(amount of years can be adjusted on the default parameters screen).
Monthly CO2 Emissions (kg): Compares emissions monthly.

Results of the project
Comprehensive Comparison
Delivered a TCO model empowering users to compare battery electric trucks with diesel equivalents.
Inclusive Cost Factors
Considered all relevant factors: vehicle chassis, body equipment, battery, fuel/energy costs, repair and maintenance, insurance, and policy interventions.
Holistic Analysis
Factored in private charging infrastructure costs and calculated annual CO2 emissions.
User Flexibility
Developed an app allowing users to vary parameters, understanding their influence on price per kilometer.
Efficient, result-oriented, and very nice to work with! Not much more to add, just as every working relationship should be!
